
July 28 2026
Changes to employer National Insurance have added an estimated £110 million a year to the bus industry’s costs, equivalent to a 2.4% increase in payroll costs, according to the latest Confederation of Passenger Transport Cost Monitor.
The report found that employer National Insurance costs rose by 33.1% between February 2025 and February 2026 following the changes introduced by the Government in April 2025. Overall labour costs increased by 4.1%.
Operators have worked hard to offset these additional costs by finding savings elsewhere. Vehicle running costs fell by 4.4%, while overhead costs were reduced by 9.5%.
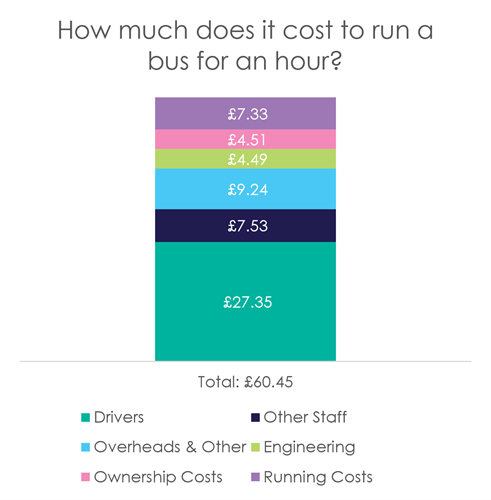
Despite those efforts, total operating costs across Great Britain outside London rose by 2.9%, from £58.76 to £60.45 per bus hour.
Cost Monitor also found that average bus speeds across Great Britain fell by 2.7% over the year, further affecting efficiency and productivity.
Graham Vidler, Chief Executive of the Confederation of Passenger Transport, said:
“Bus operators have worked relentlessly to manage rising costs while protecting the services that millions of passengers rely on. They have reduced overheads, made savings and become more efficient wherever possible.
“But there is a limit to what the industry can absorb. The Government’s changes to employer National Insurance alone have added an estimated £110 million a year to operators’ costs, equivalent to a 2.4% increase in payroll costs.
“These figures were also recorded before the latest fuel price increases hit the industry. Operators are now facing a perfect storm of higher employment costs, rising fuel bills and continued pressure from congestion and slower bus speeds.
“Government must recognise these pressures in future funding and tax decisions. A stable, long-term approach is essential if operators are to protect services, keep fares affordable and continue investing in better buses for passengers.”
Labour remains the largest component of bus operating costs, accounting for 57.8% of the total. The report also found that engineering costs rose by 28%.
The figures provide a snapshot from February 2026 and therefore predate the Middle East crisis and the subsequent sharp increases in fuel prices.
The latest Cost Monitor draws on returns covering 65% of the bus fleet and almost 85% of bus mileage operated across Great Britain outside London.
- Overhead costs refer to:
- Non-PSV Insurance Costs, such as property, public liability, employers’ liability, etc;
- Overheads, including head office costs, property costs, office running costs, auditing and accounting fees, etc;
- Non-PSV Depreciation Charges, covering such items as land and buildings, office equipment, engineering facilities and tools, and other owned assets.
- Engineering cost refers to tyres, lubricants, and other, including replacement parts, MoTs, and subcontracting.
- Running cost refers to the cost of fuel, whether diesel, electricity, hydrogen or gas.
- Ownership cost refers to the cost of ownership of the buses operated, covering depreciation charges and any costs incurred in hiring vehicles under an operating lease. These are also split by vehicle type if possible.
- Drivers and other staff costs are calculated based on numbers employed, wages and salaries, National Insurance Employer’s Contributions, Employers’ Pension Contributions, and other employee on-costs (e.g., training, uniform, staff welfare, etc.)